📋 Step-by-step installation guide
Follow these steps in order. Each step is illustrated with a real screenshot. Anyone can do it! 😊
Open the app in your browser
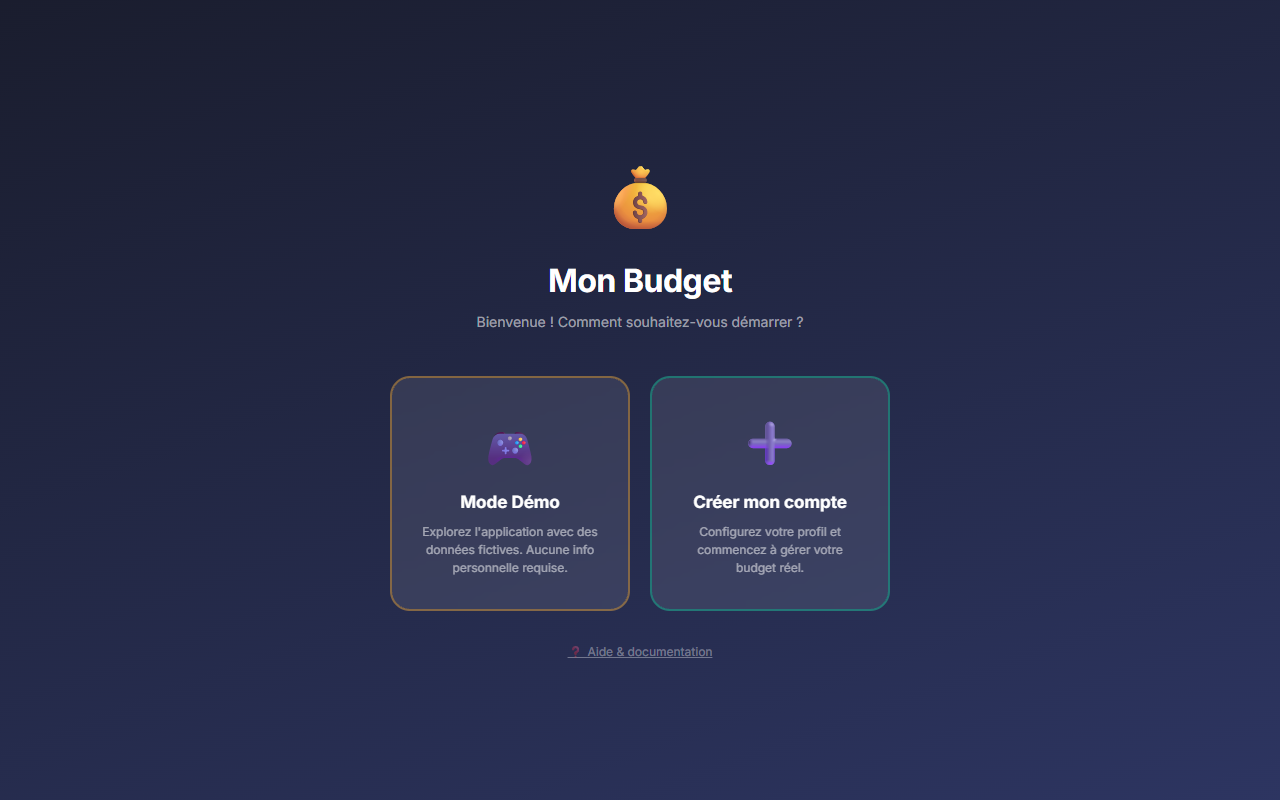
Go to the app's URL (or open the file budget_familial.html). The start screen appears with two choices.
Click your name to log in
Click on the card with your name. If you set a PIN code, you will be asked for it. Once logged in, the app opens directly.
Discover the header buttons
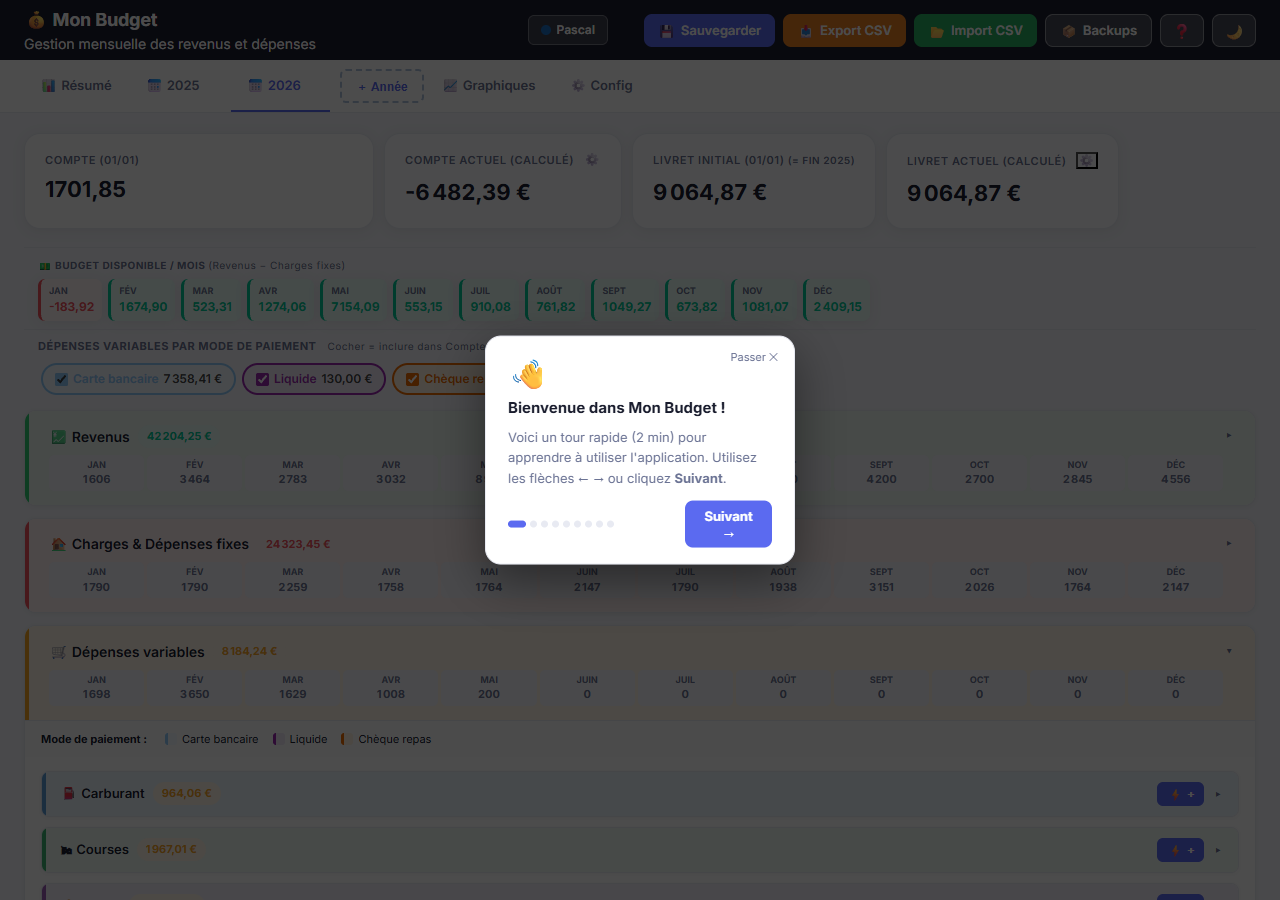
At the top of the page you'll find all the important buttons:

- 🔵 Your name — click to switch user
- 💾 Save — VERY IMPORTANT: click here after every change!
- 📥 Export CSV — export your data to an Excel file
- 📦 Backups — access your automatic backups
- ❓ Help — restart the guided tour or open this guide
- 🌙 Dark mode — switch between light/dark theme
Navigate between years using the tabs
Below the header, you can see the year tabs. Click on a year to display it. Use + Year to create a new year.

Enter your starting balances
At the top of each year, there are 4 important fields you only need to fill in once:

- Account (01/01) — Your checking account balance on January 1st
- Current account — Calculated automatically ✨
- Initial savings — Your savings account balance on January 1st
- Current savings — Calculated automatically ✨
Enter your monthly revenues
In the green 💼 Revenues section, click on each cell to enter the amount for each month. You can have multiple revenue rows (salary, benefits, etc.).

Enter your fixed costs and check them when paid
In the pink 🏠 Fixed Costs & Expenses section, enter your recurring costs (rent, electricity, subscriptions…). Each month, click on the cell to check it green when you have paid.

Record your variable expenses as you go
In the yellow 🛒 Variable Expenses section, click the small + in the correct month column to add an expense (groceries, fuel, miscellaneous…).

Check the automatic monthly summary
The blue 📊 Monthly Summary section calculates everything automatically for each month of the year.
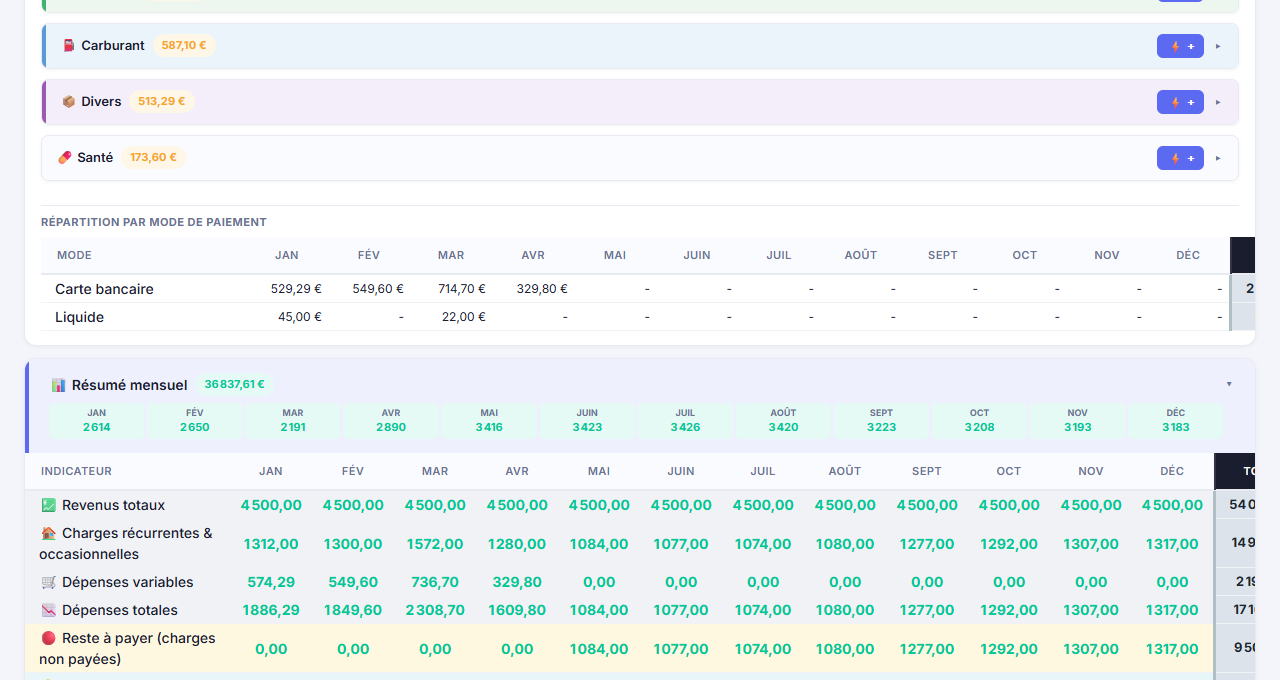
- 🟢 Revenues — total income for the month
- 🔴 Paid costs — total of checked costs
- 🟡 Variable expenses — total of entered expenses
- 🔵 Real balance — your calculated actual bank balance
- 💰 Savings — your calculated savings account balance
Save and you're done! 🎉
Click the 💾 Save button in the header. The app shows "Saved ✅" and the date/time of the last save.
🚀 Getting Started
Mon Budget is a Progressive Web App (PWA). It works offline and can be installed on your device just like a native app.
First launch
On first launch, you can choose between:
Account creation (6-step wizard)
- Profile — Your name and avatar colour
- Revenues — Your usual monthly revenues (salary, benefits…)
- Fixed costs — Your recurring fixed costs (rent, energy, subscriptions…)
- Budgets — Suggested monthly budget for each expense category (automatically converted to annual)
- PIN — Optional security code to protect your data
- Cloud — Optional Google sign-in for Premium sync
Install on mobile / desktop
On mobile (Chrome/Safari), tap "Add to Home Screen". On PC (Chrome/Edge), click the install icon in the address bar. The app then works offline.
🎮 Demo Mode
Demo mode loads fictional data so you can explore all features without any risk.
Activate demo mode
On first launch, click the Demo Mode card. The app loads with sample data (Jean & Marie, 2025–2026).
Exit demo mode
Click ✕ Exit demo mode in the banner. Confirm the deletion: all fictional data is erased and you return to the start screen to create your real account.
🖥️ General interface
The app is organised by years (tabs) and by months (columns in each table).
Header
- 💾 Save — Saves all changes in the browser
- 📥 Export CSV — Exports the current month's data as CSV
- 🖨️ PDF — Generates a structured PDF report: annual KPIs, full monthly table and expense breakdown by category for each year
- 📂 Import CSV — Imports transactions from a bank statement CSV (automatic column detection, category choice, payment method, selected total and automatic duplicate detection ⚠️)
- 📦 Backups — Shows the list of automatic backups (one per day, 10 max)
- 🔐 Login — Sign in with Google for Premium cloud sync
- ❓ Help — Restart the guided tour or open this guide
- 🌙 / ☀️ — Switch between light and dark mode
Floating buttons (bottom right)
- ➕ Green — Quick add a variable expense
- 🤖 Purple — AI Assistant (chat)
- 💳 Transactions — Opens the recent expenses widget, with the breakdown by payment method
- 💬 Feedback — Send a message or report a problem
Year tabs
Each tab represents a year. Click + Year to create a new year.1 year max in free Unlimited in Premium
Month columns
Each table has 12 columns (Jan–Dec). Enter amounts directly in the cells. Press Enter or Tab to move to the next cell.
🏠 Monthly Dashboard
The Home tab is your monthly overview: at a glance you can see where you stand financially without browsing the detailed tables.
Navigating between months
Use the ← and → buttons to move from one month to another. Year changes happen automatically (January → December of the previous year and vice versa). Use the year selector to jump directly to a year.
📅 Monthly view / 📊 Annual view
A toggle at the top right lets you switch between the monthly view (detail of one month) and the annual view which shows yearly totals, savings rate, average monthly savings, best and worst month, and a bar chart of balances month by month.
4 key indicators (KPIs)
Each card shows the selected month's value and an SVG sparkline — a mini chart representing the trend over the 12 months of the year. At a glance, you can see whether an indicator is rising or falling.
🍩 Donut chart
When there are at least 2 active variable expense categories in the month, an SVG donut chart appears below the KPIs. It shows the expense breakdown by category with the amount and percentage.
🔄 Comparison vs previous year
If you have data for the previous year, a comparison table is displayed automatically for the same month. It shows the delta (+ or −) for each indicator with green (improvement) or red (regression) colouring.
⚠️ Budget exceeded alerts
If a variable expense category exceeds its monthly budget (defined in category management), a red alert appears in the dashboard with the amount spent vs the budget.
🛒 Latest expenses
The list of variable expenses for the month is displayed, sorted by descending amount (up to 8 entries + a counter for the rest).
💳 Transactions widget — breakdown by payment method
The floating 💳 Transactions button opens a summary of recent expenses, grouped by category.
Under each category, a row of chips gives the breakdown by payment method — card, cash, meal vouchers… — and the same row appears at the top of the widget for all transactions together.
📅 "Go to current year" button
A quick button lets you navigate directly to the current year's tab (e.g. 2026) from the dashboard.
🏠 Monthly fixed costs detail
Below the KPIs and comparison, a section lists all costs for the current month (rent, subscriptions, savings transfers…) with their amount and paid status ✓.
📱 Swipe navigation (mobile)
On mobile, swiping left goes to the next month, swiping right goes back to the previous month — without needing to tap the ← → buttons.
📝 Monthly note
At the bottom of Home, a free text field lets you add a monthly note (e.g. "busy month, holidays", "bonus received"). The note is saved automatically and appears in the PDF report in a dedicated section.
🔍 Global search
Instantly find any revenue, fixed cost or variable expense row across all your years, without browsing the tables.
Open search
Click the 🔍 tab in the navigation bar (far right). Search can also be closed with the Escape key.
What is indexed
- Revenue labels — e.g. "Salary", "Bonus"
- Fixed cost labels — e.g. "Rent", "Insurance"
- Variable expenses — label, category, comment and amount of each transaction
Filters
Filters appear below the search bar to narrow results:
- Year — limit the search to a specific year
- Month — filter by a specific month
- Type — All / Revenue / Fixed costs / Variables
A Reset button appears as soon as a filter is active.
Results
Results are grouped by year with the type and amount. Clicking a result opens the transaction directly in its category and month (the detail row expands automatically) and closes the search.
🎯 Monthly savings goal
Set a monthly savings goal in euros. A progress bar is displayed in the Home tab to track your progress.
Configure the goal
- Open the ⚙️ Settings tab
- Scroll down to the 🎯 Monthly savings goal section
- Enter the target amount (e.g. €500/month)
- Click ✅ to save
Progress bar
In the 🏠 Home tab, the bar shows the percentage of the goal reached for the displayed month:
- Green — Goal reached or exceeded 🎉
- Blue — On track (positive balance but below the goal)
- Red — Negative balance, goal not achievable this month
💼 Revenues
Enter your monthly revenues (salary, benefits, bonuses…) in the green section.
Add a revenue
Click + Add a revenue at the bottom of the section. Enter the label and amounts month by month.
Toggle "Included in calculation"
The ∑ column (included in calculation) determines whether this revenue is counted in the monthly summary. Uncheck to temporarily exclude a revenue without deleting it.
Delete a row
Hover over the label of a row to reveal the red ✕ button. Click it to delete (confirmation is requested).
🏠 Fixed Costs
Fixed costs are recurring expenses: rent, energy, subscriptions, insurance…
"Paid" status
Each cost cell has a payment indicator. Click the cell to toggle between paid (green) and unpaid (grey). Only costs marked as paid are included in the real balance calculation.
Cost types
- Fixed — Same amount every month
- Occasional — Variable amount depending on the month
- Transfer to "savings name" — The list offers each of your savings and investment accounts by name, no longer a single savings account. See Savings & investments.
- Withdrawal from "savings name" — Same, the other way round.
- Gain / Loss in value — Interest, capital gain or loss: the savings account moves, the checking account does not.
Each savings account has its own block in the table, titled with its name: savings movements are no longer mixed in with occasional costs.
↩️ Undoing a change
An "↩️ Undo" pill appears at the bottom right as soon as there is something to undo. Ctrl+Z works too, and Ctrl+Shift+Z redoes.
Up to twelve changes can be undone in a row. All of them count: an entry, a deletion, a repair tool, a carry-over to later years.
End date of a row
A cost that comes to an end — a loan, mortgage insurance, a cancelled subscription — can carry an end date, set in its edit window (✏️). It then appears under the label, for example "ends March 2028", and the row is no longer carried beyond that.
How that date propagates to years already created is described in Carrying over to later years.
Comments on a cell
Every amount cell, in costs as well as revenues, can carry a comment. A small purple badge marks the cells that have one: hover to read the note, click to write, edit or delete it.
Remaining to pay
At the bottom of each summary table, a "Remaining to pay" row shows the total of costs not yet paid for the month.
🛒 Variable Expenses
Variable expenses (groceries, fuel, miscellaneous…) are entered as individual transactions.
Available categories
In the free version you have 3 categories (groceries, fuel, miscellaneous). In Premium, create as many as you want from ⚙️ Settings → Categories.3 max in free Unlimited in Premium
🔎 Filter categories
A search field at the top of the "Variable Expenses" section lets you filter categories by name in real time. Useful when you have many categories (Premium).
Add an expense
Click the + button in the correct month column. A row is added with the amount, an optional comment, the date and the payment method.
Payment methods
- Card — Bank card payment (default)
- Cash — Cash payment
- Meal voucher — Restaurant tickets / meal vouchers
Category colours
🎯 Category budgets
Set an annual budget for each variable expense category and track your progress in real time.
How it works
For each category (groceries, fuel…), you can set an annual budget. A progress bar is displayed below the category title, showing how much you have spent relative to the goal.
Set a budget
Three ways to set a budget:
- At account creation — The setup wizard suggests amounts (e.g. groceries €300/month) at step 4. Adjust them, then confirm. Amounts in €/month are automatically converted to €/year.
- When adding a category — In ⚙️ Settings → Categories, enter an amount in €/month or €/year when adding a new category.
- Via Settings — In ⚙️ Settings → Categories, edit the Budget/year € field directly on the existing category row.
Missing budget alert
When you click ⚡ + or use Quick add for a category without a budget, an orange alert appears in the form with a Set a budget → link. Click it to enter a monthly amount immediately.
Edit a category
In ⚙️ Settings → Categories, you can now directly edit the icon and label of an existing category by clicking the corresponding fields. No need to delete and recreate.
💰 Savings & investments
Every savings account and every investment account has its own block in the costs table, titled with its name. Savings movements are no longer mixed in with occasional costs.
Create a savings or investment account
Go to ⚙️ Configuration → Accounts & Savings, type a name and confirm with + or the Enter key. You can create as many as you need: savings account, home-works fund, securities account, market investment…
Each one then gets its own gear ⚙️ on that same page, giving access to its options without going through the yearly view.
Rows dedicated to an account
- 📈 Standing order (
livret_in) — Automatic monthly transfer from checking to savings. Increases savings, decreases checking. - 💰 Account → Savings (
livret_in) — One-off deposit. Same effect. - 📉 Savings withdrawal → account (
livret_out) — Withdrawal to the checking account. Decreases savings, increases checking.
In a row's edit window, the Type list offers each of your accounts by name, for deposits as well as withdrawals. A row can therefore be filed under one account, moved from one to another, or created directly as a savings movement.
Interest, gains and losses
A gain or loss in value has no counterpart on the checking account: the money never passes through it. A special row is therefore needed, otherwise your checking account would be wrong.
In an account's configuration, the "Gain/loss" button creates the two rows you need:
- a gain row, which increases the account without touching checking — yearly interest, capital gain on an investment;
- a loss row, which decreases the account without touching checking — capital loss, custody fees.
📊 Tracking performance
An account's page — ⚙️ Configuration → Accounts & Savings, then its gear — shows a Performance panel:
- Total invested — the money you actually put in, deposits minus withdrawals.
- Current value — what the account is worth today.
- Gain / loss — the difference between the two, in euros and as a percentage.
The distinction is deliberate: paying in another €100 is not a gain. Only interest and capital gains or losses count towards the return.
Below those figures, a chart plots two lines: the money invested (dashed) and the value (solid). The gap between them is your return — if the solid line runs above, you are ahead. A table then lists only the months where something moved, with the difference for each.
🔄 Realigning the value during the year
The "Update value" button on that same page asks for the amount your bank shows today. The difference from the calculation goes automatically into a gain or loss for the current month — you no longer work it out yourself.
The app also offers it at the start of each quarter: April, July and October, within the first ten days, at most once a day. "Later" pushes it to tomorrow, "No more reminders this quarter" until the next one. January is left out, as the real balance reminder already covers every account.
Opening balance
For the first year, enter the balance on 1 January in the field provided. For later years it is carried over automatically from the balance calculated on the previous 31 December — nothing to do. An amount you enter by hand always takes priority.
The mechanism, shared by accounts and savings, is described in Accounts & balances.
Entering amounts
Always enter positive values. The app handles the direction (deposit or withdrawal) based on the row type.
🏦 Accounts & balances
You can track several accounts side by side — checking account, business account, meal-voucher card — in addition to your savings and investment accounts.
Add an account
⚙️ Configuration → Accounts & Savings: type a name and confirm with + or the Enter key. Each account gets its own balance row in the monthly summary.
The 1 January balance carries over by itself
An account's opening balance is, by default, the balance calculated on 31 December of the previous year. Savings accounts already worked that way; accounts joined them in version 13.40. Before that they started from zero, which threw off the whole year until a balance was entered.
Reminder of real balances on 1 January
From 1 January, the app asks you once a day to enter the real balance of each account, savings and investment, until it is done. A year created in advance does not trigger this reminder early.
Why it matters: a savings account earns interest and an investment moves with the market. Those movements appear nowhere in your entries, so the balance calculated by the app always ends up drifting from your bank's real balance.
The difference is recorded automatically
If the real value you enter on 1 January differs from the calculation, the gap is not silently discarded: it is recorded in December of the previous year, in a row named "Real balance adjustment". The past year stays consistent, and the new one starts on the right figure.
📊 Monthly summary
The summary table shows the full breakdown for each month: revenues, costs, expenses and balances.
Summary rows
- Revenues — Total revenues marked as "included in calculation"
- Paid costs — Total costs marked as paid
- Variable expenses — Total of entered transactions
- 🔴 Remaining to pay — Costs not yet paid
- Available — Revenues − paid costs − variable expenses
- REAL BALANCE — Checking account balance calculated from the start of the year
- Savings — Savings account balance at the end of the month
🏆 Annual statistics
Below the summary table, statistics cards are displayed for each year: annual savings rate, average monthly savings, best and worst month (by balance), highest variable spending month, and the most costly variable expense category.
Starting balances
At the top of the page (section Starting balances), enter:
- Account (01/01) — Checking account balance on January 1st
- Initial savings — Savings balance on January 1st (auto-calculated for subsequent years)
📈 Financial indicators (KPI)
Four key indicators are displayed automatically at the top of each year to evaluate your financial health at a glance.
💶 Cash-flow forecast
In the Charts tab, a curve plots your account balance month by month, built from the schedule you have already entered — not from an average.
- Solid line up to the current month: what is on record. There, the curve matches exactly the balance shown everywhere else.
- Dashed beyond: what is planned, from your entered amounts, whether ticked as paid or not.
The forecast low point — the month your account will dip lowest, and by how much — is repeated under the Projection indicator in the yearly view. The box turns red if the balance goes negative.
Year-end projection
In the monthly summary, a projection row appears if you have at least 1 month of data and the year is not yet over. It calculates your estimated annual savings based on your current monthly average.
📉 Charts
The Charts tab offers several visualisations of your finances, filterable by year. A 📅 Go to [current year] button lets you jump back directly to the current year's tab.
💾 Backup and backups
All data is stored locally in your browser (localStorage). Remember to save regularly.
Updating the app
When a new version is available, the app no longer reloads by itself while you are typing: an "Update" banner appears discreetly at the bottom of the screen. You choose when to reload.
Manual save
Click 💾 Save in the header. A green notification confirms the save. The date/time of the last save is displayed on the right.
Automatic daily backup
With each save, a dated copy is created automatically. The app keeps the last 10 backups (one per day).
It was 30 until version 13.21: thirty copies of the budget filled up phone storage, to the point of blocking the saving of the data itself.
Restore a backup
Click 📦 Backups in the header. The list of backups appears with their dates. Click Restore to go back to a previous state.
📥 External backup — Export / Import JSON
To avoid any risk of loss when clearing cache, you can export your data as a JSON file:
- Go to ⚙️ Settings
- In the 📥 External backup section, click ⬇️ Export JSON
- A file
budget_backup_XXXX.jsonis downloaded — keep it somewhere safe (cloud, USB drive…) - To restore, click ⬆️ Import JSON and select the file
🐙 Free cloud sync via GitHub Gist
GitHub Gist sync saves your data online automatically with every save. If you clear your cache or switch device, your data can be recovered in one click.
Export CSV
Click 📥 Export CSV to download your monthly data as a spreadsheet. This file can be re-imported via 📂 Import CSV.
🌙 Dark mode / Light mode
Switch between light and dark theme at any time.
Click the 🌙 (dark mode) or ☀️ (light mode) button in the top right corner of the header. The choice is remembered and will persist on the next visit.
📅 Create a new year
Each year is independent. Create a new year to start tracking a new financial period.1 year max in free Unlimited in Premium
Procedure
- Click + Year to the right of the year tabs
- A window appears with your usual revenues and costs, each shown with the last amount actually paid and the rhythm carried over ("every month", "November only", "quarterly"…)
- Adjust the amounts if needed
- Click ✅ Create year
The year is created with:
- The revenues you confirmed
- The previous year's costs, each at its own rhythm (see below)
- Opening balances for accounts and savings, carried over from the previous 31 December (see Accounts & balances)
- No variable expenses (to be entered throughout the year)
Each row keeps its rhythm
Since version 13.29, a row is no longer copied across all twelve months: it takes back the months it occupied in the previous year. A yearly repayment paid in November stays in November, a quarterly charge keeps its quarters, and a monthly payment started mid-year moves to twelve full months.
Finished rows are not carried over
A row whose end date has passed is not carried into the new year. The creation window lists them explicitly at the bottom, under "Not carried over (end date passed)" — so an end date set by mistake no longer makes a cost disappear silently.
Delete a year
Hover over the year tab → click the ✕ that appears. Confirmation is requested with an option for automatic backup.
⏭️ Carrying over to later years
When you change a row in the current year, the app updates the same row in the years already created. Without this, everything had to be re-entered year by year.
What is carried over
- The amount — When you change an amount in the table, a window offers to apply it to that month only, to all remaining months of the year, or to later years as well.
- The end date — A loan ending in 2026 now also ends in 2027 and beyond. Before version 13.32, the date only applied to the year you had open.
- The label, the type and the linked account — Renaming or reclassifying a row updates it everywhere.
- The display order — Moving a row puts it in the same place in later years (version 13.50). A cost added at the bottom of the table and then moved up would otherwise stay at the bottom the following year.
- A brand-new row — See below.
Adding a row to years already created
A row created in one year can be added to later years in one click: a checkbox offers it, already ticked for a recurring row with no end date. The rhythm is carried across the whole year.
The app then asks you which amount to continue with. The current year's amount is suggested: correct it if your salary or your subscription changes the following year.
For a row that already exists but is missing from a later year — typically a row added after that year was created — the same checkbox appears in the edit window (✏️).
📌 Stopping a row from being carried over
Some rows only make sense in their own year: a sale, a bonus, a one-off expense. In the edit window (✏️), tick "Specific to this year — do not carry over".
- The row is not taken into a new year, and no longer appears in the year creation window.
- Check my data stops reporting it as missing from later years.
- Its amount in the year it lives in is left untouched.
What is never carried over
- Months already paid in the current year and past years: an amount actually paid is never rewritten.
- Earlier years: carrying over only goes forward.
- Cell comments: they refer to the year in which they were written.
- Amounts entered by hand month by month: a row with variable amounts is flagged as such in its edit window, and carrying over leaves it alone.
🔧 Repair tools
⚙️ Configuration → Data gathers a few tidy-up buttons. Each one only appears if it actually has something to fix, and says how many rows or tables are affected.
🩺 Check my data
The "Check my data" button runs six checks at once and answers in every case — including when all is well. That is the point of it: the tools below only appear when they have something to fix, so their absence never told you whether the app had even looked.
Each problem is explained, and its repair button sits right there in the report.
Rows missing from a later year are listed one by one, with the years they are missing from. A ✏️ beside each one opens it directly: all that is left is to tick "Add to later years".
Available tools
- Fix the months of a year — For a year created before version 13.29, whose rows had been copied across all twelve months. They recover the previous year's rhythm. Rows you edited by hand are not modified.
- Carry end dates forward — Applies end dates you have already entered to later years, for years created before carrying over existed.
- Restore savings rows — Puts back into their account the rows that had switched to recurring costs before version 13.33.
- Align row order with the previous year — For years where rows had piled up at the bottom of the table. Only the display order changes, no amount is touched.
🔐 Login & Cloud Account
Create an account with your email address to access cloud sync and activate Premium.
Why log in?
Without a login, your data is stored only in your browser. With a connected account:
- ✅ Automatic sync in Firebase cloud (Premium)
- ✅ Access from multiple devices (PC, phone, tablet)
- ✅ Your data is recoverable if you change browser
- ✅ Automatic Premium activation after Stripe payment
How to create an account / log in
- Go to the ⚙️ Settings tab and click 🔐 Log in
- Enter your email address and a password
- If it's your first time: click Create account — a verification email is sent
- If you already have an account: click Log in
- Your email appears in Settings — you are logged in ✅
🔄 Multi-device sync
With a Premium licence, your data moves between your devices — PC, phone, tablet. This page explains how to check that all is well, and what to do if two devices drift apart.
Check a device's status
⚙️ Configuration → Cloud shows a Status line telling you where the device stands:
- Up to date with the cloud — Nothing to do.
- Behind — Other entries exist elsewhere and have not arrived here yet.
- Entries waiting to be sent — This device has changes the cloud has not received yet.
A version number comes with that status, in the form "seen 22 / cloud 22". Two healthy devices show the same number.
Bringing two devices back in line
Always in this order, starting from the device that holds the correct data:
- On the reference device: Configuration → Cloud → Send to cloud
- On the device that is out of step: Configuration → Cloud → Fetch from cloud
- Check that both show "Up to date with the cloud" and the same version number
The sync log
The same page holds a log: every startup and every exchange with the cloud leaves a dated trace there, and a button copies the whole thing. This is what to provide if you report a sync problem — it says precisely why a device did not update.
The reason for each decision is readable there: a-jour, en-avance, en-retard and conflit are normal. sans-compteur flags an unusual situation on the cloud side.
🗄️ Cloud backups
Every day, on the first send to the cloud, a full copy of your data is kept server-side. The last ten days are retained, and the list is available under ⚙️ Configuration → Cloud → Cloud backups.
This is a safety net the browser backups never provided: those vanish with the device's storage, and the cloud only ever held the current state. If bad data spread there, it was everywhere, with nothing to go back to.
- Snapshots sit beside the synchronised data, never inside it: sync never sees them.
- They are reachable from any of your devices.
- A restore first creates a local backup, then propagates to your other devices.
Your registered devices
The list of your devices sits in the same place, with the date each was last used, and you can remove one. This matters because clearing a device's storage gives it a new identity: the old entry would otherwise stay in the list forever.
When the device limit is reached, the least recently used one gives up its slot to the new device, instead of blocking it.
If a device stays stuck behind
The most common cause is full local storage: the data does arrive, but can no longer be saved. Storage usage is shown in Configuration → Cloud. The app now sacrifices old backups by itself to let the data through, and reports the incident instead of failing silently.
For a device left offline for a long time, clear its storage from the system settings — not just the cache — without opening the app first, otherwise the stale cached code runs before anything else. You will be asked to sign in again, which is normal.
Deleting a year
A year deleted on one device is deleted for good on all of them. Until version 13.49, a device that still held it would put it back into circulation and it reappeared everywhere.
➕ Quick Add button
The green ➕ button at the bottom right lets you add a variable expense quickly, from any view.
How to use it
- Click the green ➕ button at the bottom right of the screen
- A form appears with fields: category, amount, month, comment, payment method, day
- The year and month are pre-filled based on the active tab
- Enter the amount and click ✅ Add
Available fields
- Category — Groceries, fuel, miscellaneous, or your custom categories Premium
- Amount — The expense amount in euros
- Month — The month to assign the expense to
- Comment — Optional note (e.g. "Lidl", "Full tank")
- Payment method — Card, cash, meal voucher…
- Day — The day of the month (optional)
📷 Scanning a receipt
Rather than typing the amount by hand, you can photograph the receipt: the app extracts the total and fills it into the form.
- In the quick-add form, choose 📷 Photo to open the camera, or 🖼️ Gallery to pick an image you already have
- Frame the receipt, making sure the total is legible
- The detected amount fills the field — check it and correct it if needed before confirming
🤖 AI Assistant (Groq)
The AI assistant answers questions about your 10 most recent transactions in natural language. Powered by Groq — free, no credit card required.
Activate the assistant (2 minutes)
- Go to console.groq.com/keys
- Create a free account (email + password, no credit card)
- Click Create API Key
- Give it a name (e.g. "Mon Budget") and copy the generated key (starts with
gsk_…) - In the app, go to ⚙️ Settings → AI Assistant
- Paste the key in the field and click ✅ Save
Using the chat
- Click the purple 🤖 button at the bottom right
- The chat panel opens
- Type your question and press Enter
- The assistant replies based on your real data
Example questions
"What was my last transaction?"
"My latest fuel purchases?"
"Recent card purchases?"
"Summarise my latest expenses"
Conversation history
The chat history is saved automatically on your device (localStorage). You'll find your previous exchanges every time you open the chat. The 🗑️ Clear button wipes the history.
Privacy
Your budget data is sent to the Groq API only when you ask a question. Groq uses the Llama 3.1 model (open-source). The API key is stored only in your browser, never on our servers.
💬 Feedback & Suggestions
Send your ideas, bug reports or questions directly from the app. Every message is read and handled personally.
Send a message
- Click the 💬 icon at the bottom right of the app
- Choose the category: 🐛 Bug, 💡 Idea, ❓ Question or 💬 Other
- Enter a subject and your message
- Give an optional ⭐ rating
- Click 📤 Send
Tracking your request
Each feedback receives a status that evolves as it is processed:
- 🟠 New — received, not yet read
- 🔵 Read — taken into account
- 🟣 In progress — being processed
- 🟢 Replied — a reply has been sent to you by email
- ⚫ Closed — processing complete